Tell us about the job
Takes about a minute. No obligation.
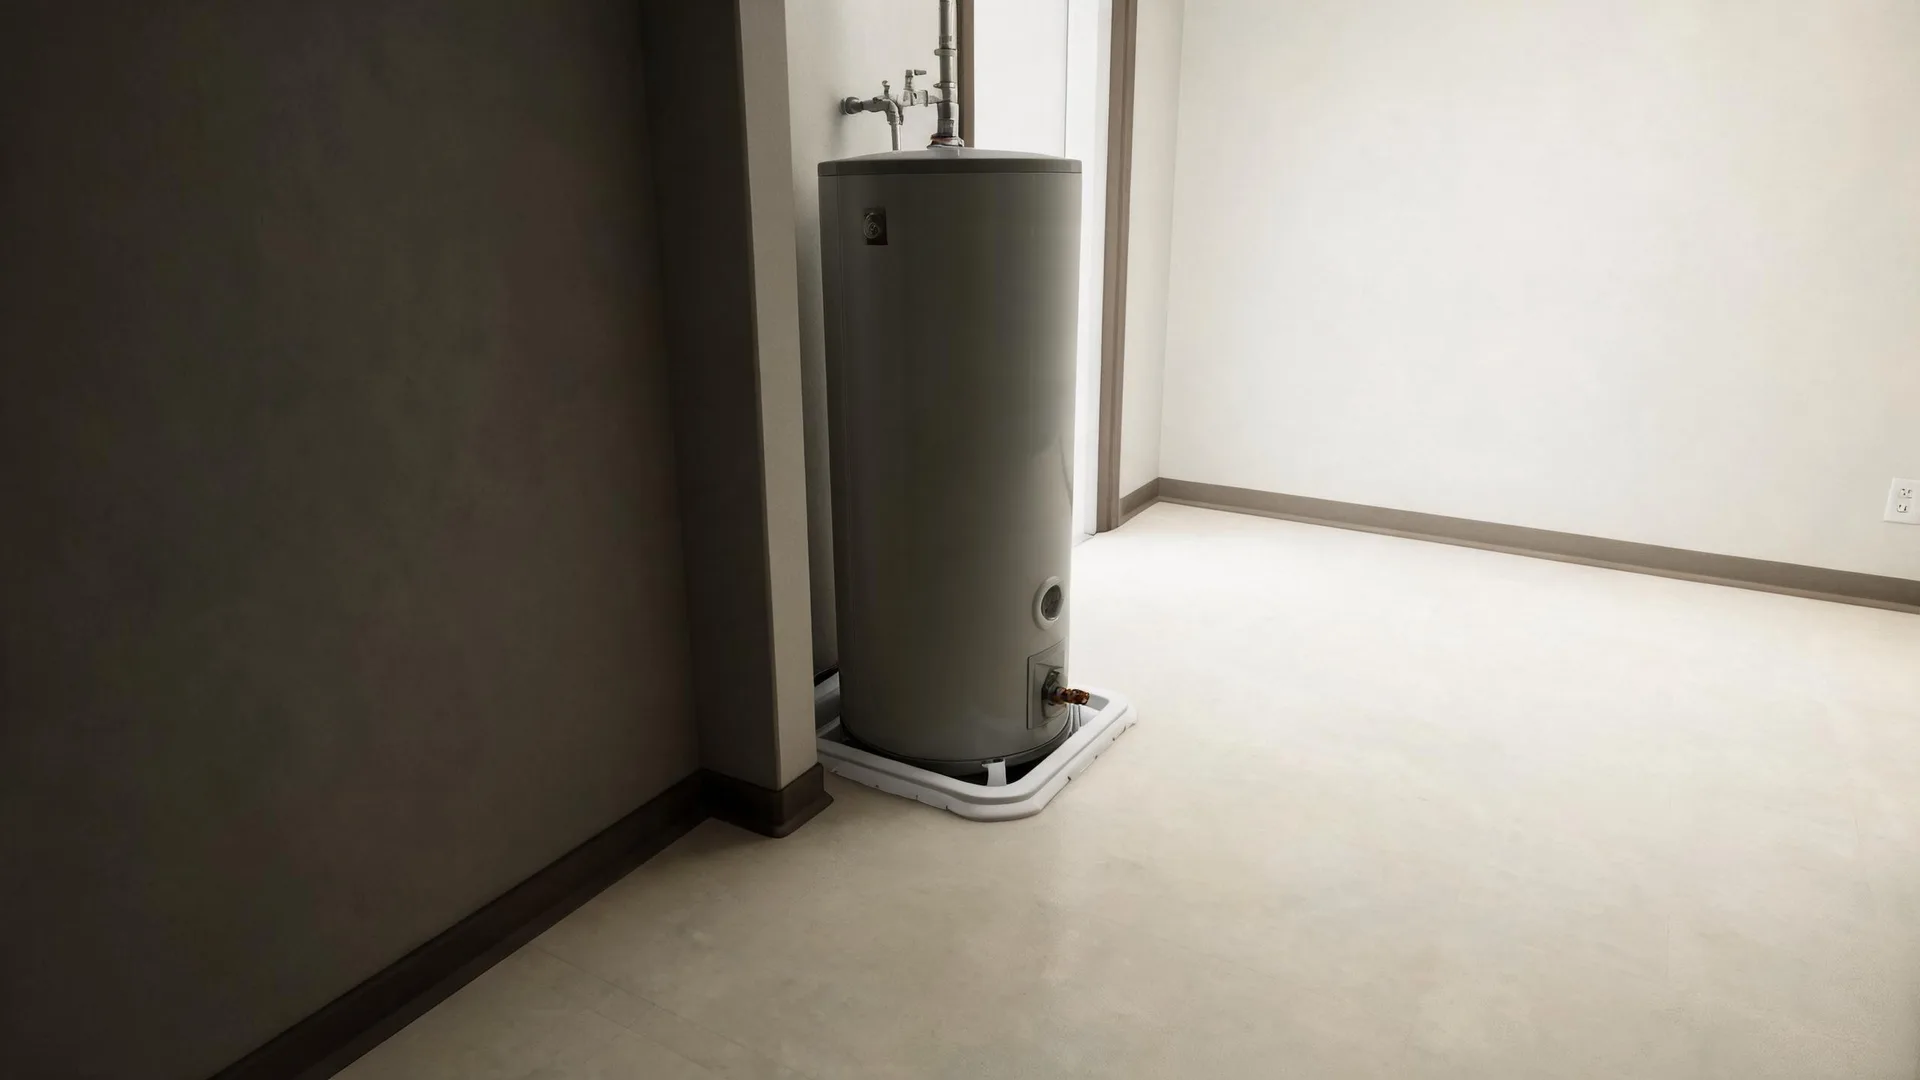
Gas water heater installation in Fremont County starts with the venting, not the tank. Utility gas heats more occupied homes in Fremont County, Colorado than any other fuel, at 64.9% (2020-2024 ACS 5-year). A contractor quoting a replacement here has to confirm that the flue can handle the new unit's exhaust volume and that the space around the heater draws enough combustion air, because both of those are decided by the fuel the home already burns. Get either one wrong and the unit runs inefficiently or backdrafts. The installer sets the venting path before the new heater goes in.
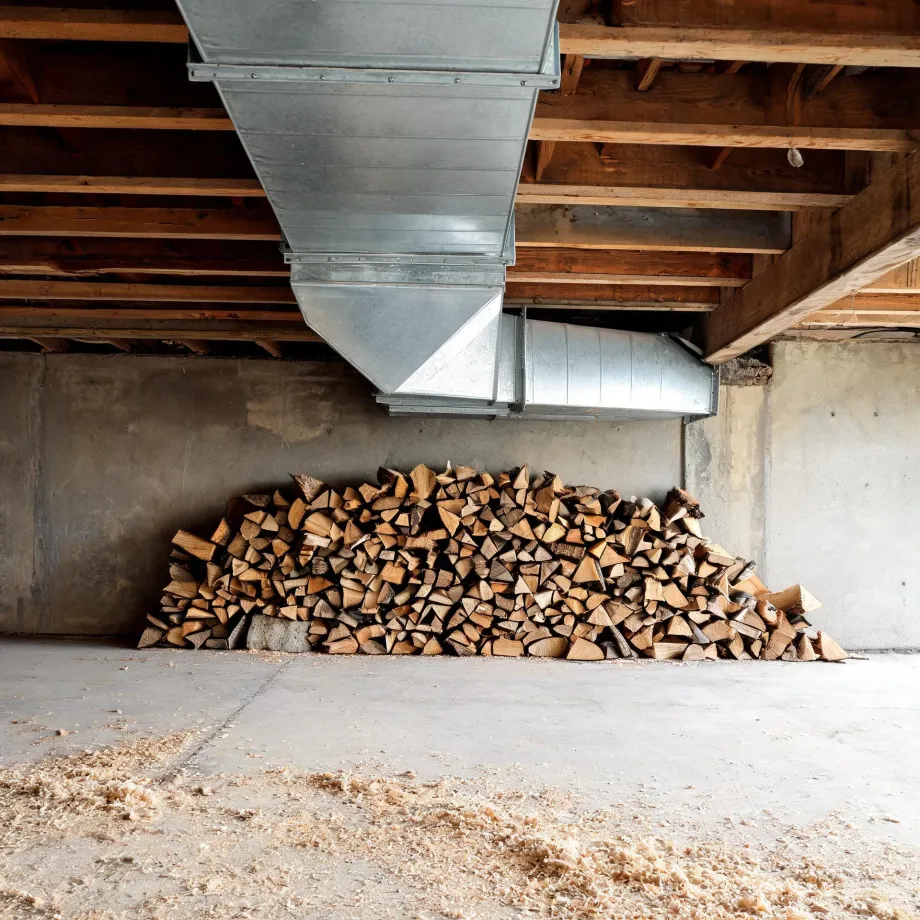
Ductwork sized and routed for an older system does not automatically carry a new one. Half the homes in Fremont County, Colorado were built in 1981 or earlier (2020-2024 ACS 5-year). What that means for a water heater installation is that the existing runs may need to be assessed before a contractor can price the job accurately, because the path from the unit to where it needs to deliver is not always what it looks like from the utility room. Electrical service in houses of this vintage can carry the same uncertainty.
What a Water Heater Installation Covers
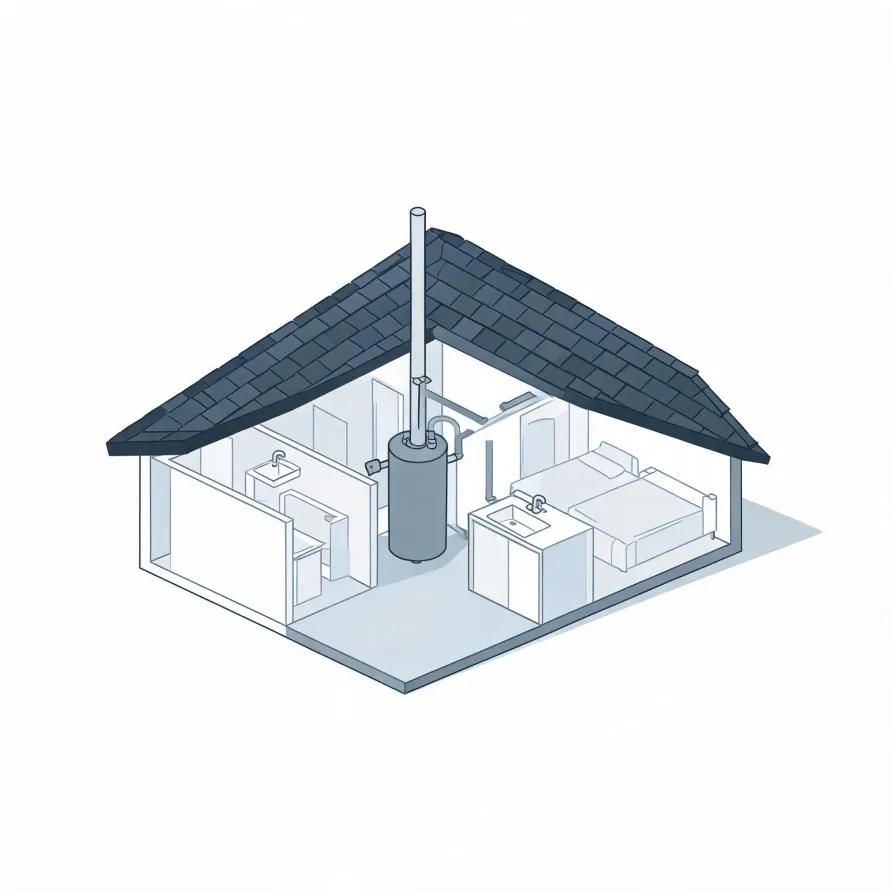
The tank or unit itself sits in a utility closet, basement, or garage and holds the water your household draws on throughout the day. A contractor sets the unit in place, connects it to the cold supply line coming in and the hot line going out, and positions the pressure relief valve on the side or top of the unit where it can do its job safely.
The flue or exhaust vent runs from the top of the unit up through the wall or ceiling to carry combustion gases outside, and the gas line or electrical feed ties into the unit depending on its fuel source. A drain pan sits beneath the unit to catch any discharge, and the shutoff valves on the supply lines give whoever services the system a way to isolate it.
The drawing shows a standard layout, and a licensed contractor determines what the specifics of your home require.
Get matched in Fremont CountyFremont County, by the numbers
487 severe weather events were recorded in Fremont County, Colorado between 2015 and 2024.
NOAA National Centers for Environmental Information, Storm Events Database, bulk CSV export, events 2015-01-01 through 2024-12-31.Half the homes in Fremont County, Colorado were built in 1981 or earlier (2020-2024 ACS 5-year).
U.S. Census Bureau, 2020-2024 American Community Survey 5-Year EstimatesFremont County, Colorado holds 20,605 housing units (2020-2024 ACS 5-year).
U.S. Census Bureau, 2020-2024 American Community Survey 5-Year EstimatesOwners occupy 75.6% of the occupied homes in Fremont County, Colorado (2020-2024 ACS 5-year).
U.S. Census Bureau, 2020-2024 American Community Survey 5-Year EstimatesSevere Weather Events in Fremont County
Fremont County's climate puts real pressure on water heating equipment, from ground-level cold snaps to the temperature swings that come with high-elevation living. How hard that equipment has to work is a local question, and the weather record is part of the answer.
487 severe weather events, 2015–2024. Source: NOAA National Centers for Environmental Information, Storm Events Database.