Tell us about the job
Takes about a minute. No obligation.
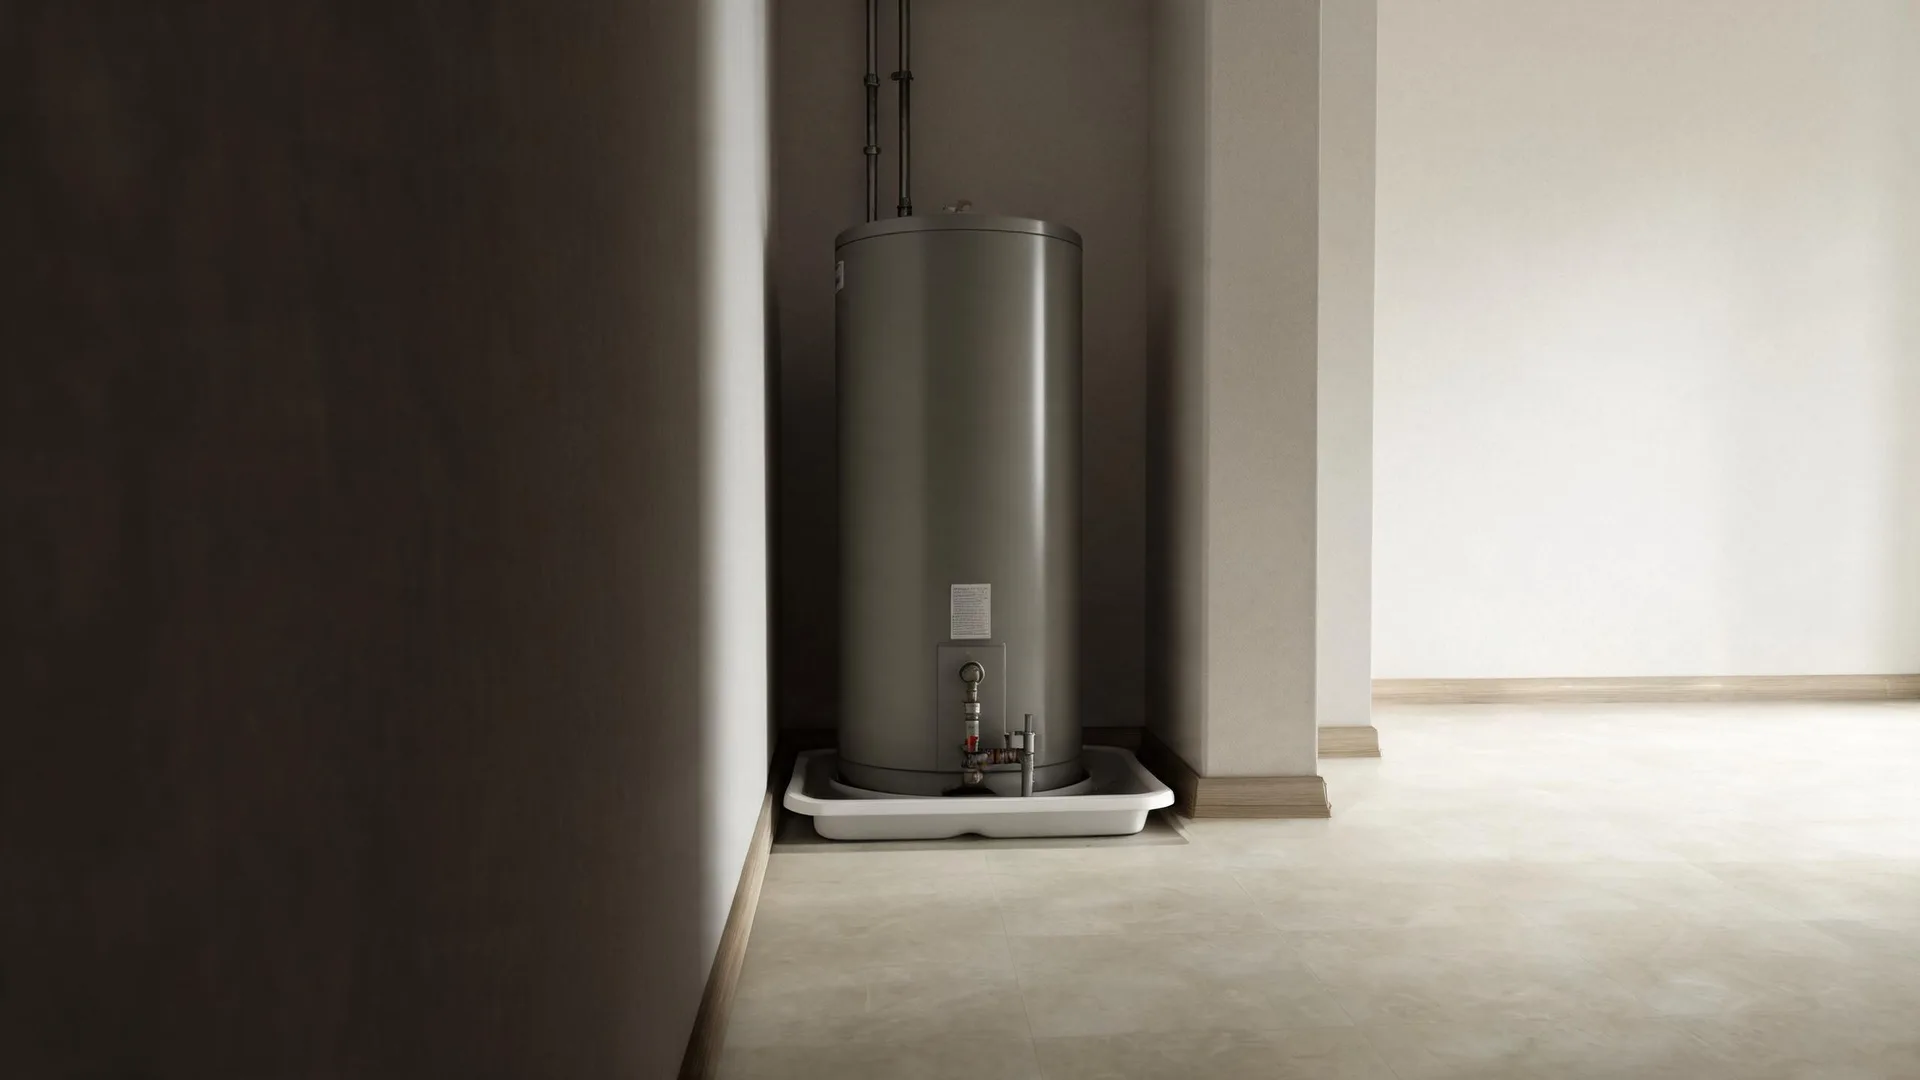
A contractor quoting a water heater installation in El Paso County starts with fuel, because the venting configuration, combustion air requirements, and the equipment itself all follow from what the home burns. Utility gas heats more occupied homes in El Paso County, Colorado than any other fuel, at 69.3% (2020-2024 ACS 5-year). That share of the housing stock means gas-fired equipment is the baseline here, and a replacement has to be sized and vented to match what the home's existing gas supply and flue can support. Swapping a tank for one with different input ratings, or changing the flue diameter, can push the installation outside code, which is what a licensed contractor establishes before anything is ordered.
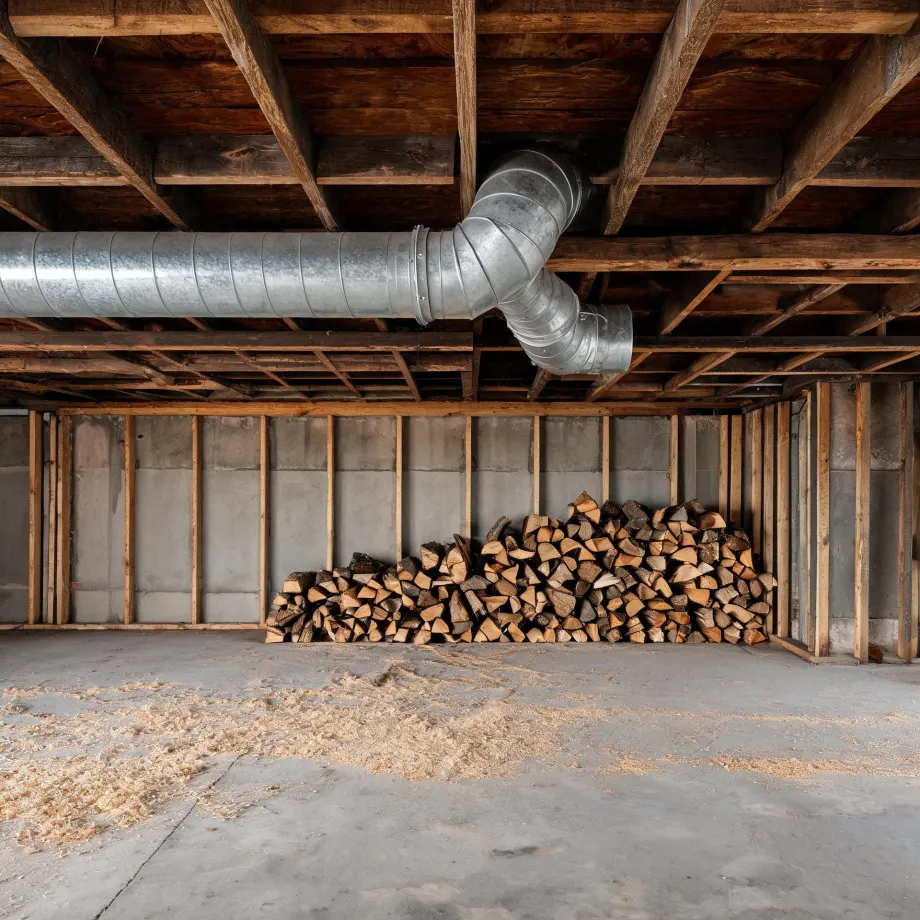
Ductwork is one question; the electrical panel is a harder one. Half the homes in El Paso County, Colorado were built in 1989 or earlier (2020-2024 ACS 5-year). Houses built in that era were wired for the loads of the time, and a high-efficiency electric water heater draws more than what many of those panels were laid out to handle. A contractor will open the panel box and read what is actually there before the quote is written, because an undersized service means an upgrade runs alongside the water heater install, not after it.
What a Water Heater Installation Covers
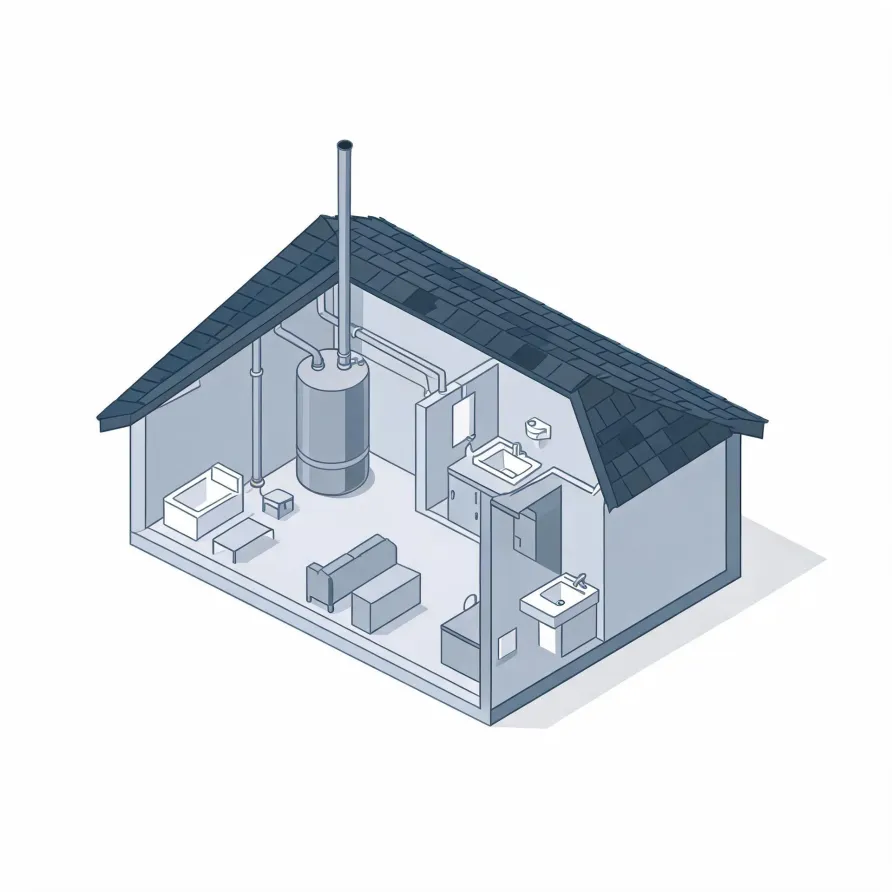
The tank is the piece a homeowner sees first, usually standing in a utility closet, basement, or garage. It holds and heats a supply of water drawn from the home's cold water line. The pressure relief valve mounts directly on the tank and releases pressure if the unit runs too hot.
The flue or vent pipe runs from the top of the tank up and out of the house, carrying combustion gases away on gas-fired units. A drain valve sits near the base of the tank. The cold supply line and hot outlet line connect at the top, tying the new unit into the home's existing plumbing.
The drawing shows a typical layout, and a licensed contractor determines what applies to this particular home.
Get matched in El Paso CountyEl Paso County, by the numbers
1,277 severe weather events were recorded in El Paso County, Colorado between 2015 and 2024.
NOAA National Centers for Environmental Information, Storm Events Database, bulk CSV export, events 2015-01-01 through 2024-12-31.Half the homes in El Paso County, Colorado were built in 1989 or earlier (2020-2024 ACS 5-year).
U.S. Census Bureau, 2020-2024 American Community Survey 5-Year EstimatesEl Paso County, Colorado holds 303,482 housing units (2020-2024 ACS 5-year).
U.S. Census Bureau, 2020-2024 American Community Survey 5-Year EstimatesOwners occupy 66.2% of the occupied homes in El Paso County, Colorado (2020-2024 ACS 5-year).
U.S. Census Bureau, 2020-2024 American Community Survey 5-Year EstimatesSevere Weather Events in El Paso County
El Paso County's climate puts real demand on water heating equipment, and that demand shifts with what the weather does year to year. How hard a system works over its life is a local question, which is why local conditions belong on a page about installation.
1,277 severe weather events, 2015–2023. Source: NOAA National Centers for Environmental Information, Storm Events Database.